Advanced Central Monitoring Software
LS OBSERVER CMS is a powerful software solution for spectrum monitoring, capable of controlling both LS OBSERVER and third-party monitoring devices—whether locally or across a complete network.
Equipped with a comprehensive set of features, LS OBSERVER CMS enables real-time monitoring, direction finding, geolocation, automatic violation detection, ITU compliant signal parameter measurement, advanced analysis, demodulation, and AI-based features for anomaly detection and signal classification. Designed for ease of use, it offers an intuitive interface alongside a wide range of automated functions, allowing operators to focus on what matters most: efficient and accurate spectrum monitoring.
Experience the efficiency and user-friendliness of LS OBSERVER CMS and take your monitoring operations to the next level.
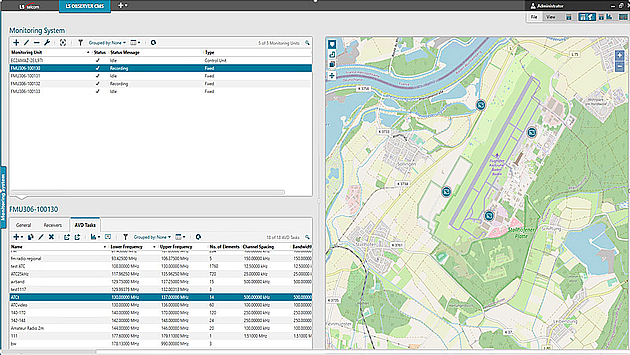
Management of various monitoring units
- Management of networked monitoring units
- Control of LS OBSERVER and 3rd party (e.g. R&S) equipment
- Operating status and GPS position on map for each unit
- Remote maintenance
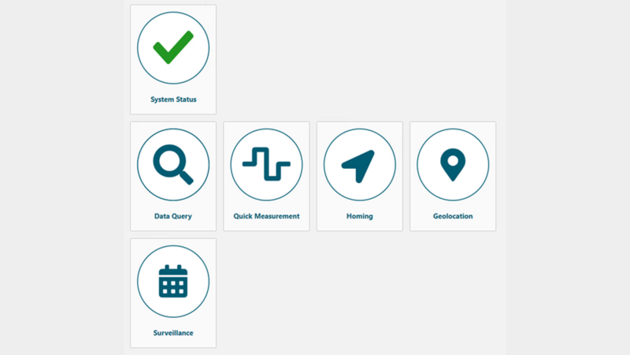
Cockpit (NEW)
- Start various types of predefined measurements, queries, jobs and complex automated workflows with a single click
- Different “Tiles” for different functionalities
- System Status: Quickly view the status of all connected units
- Data Query: Quickly filter and find stored data
- Quick measurement: Quickly start measurements with pre-defined parameters
- Homing: Quickly start homing missions with pre-defined parameters
- Geolocation: Quickly start geolocation tasks (TDOA/AOA/Hybrid) with pre-defined parameters
- Surveillance: Initiate a pre-defined measurement job including automatic violation detection + “History” to quickly jump to recorded data
- Cards
- Tasks/queries per Tile for pre-defined parameter sets
- Typically defined per band or signal of interest (e.g. 5G, LTE, ATC, digital broadcast, etc. )
- Efficient standardized operations: Defined by expert and re-used by operators in their daily tasks
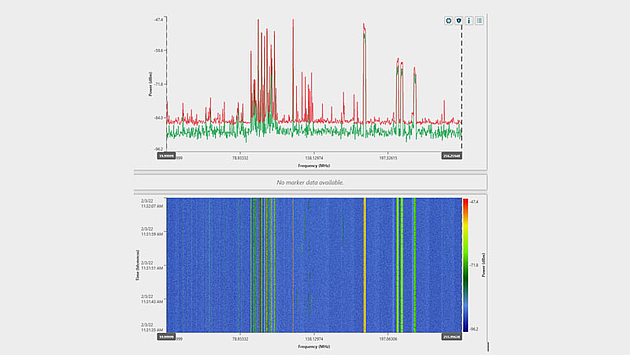
Measurements & Analysis
- Scan and fixed frequency mode
- Frequency list measurements NEW
- Analysis options: channel power/field strength, PSD, direction, signal parameters, signal classification
- ITU compliant signal parameter measurements
- AI based signal classification
- Demodulation
- Channel power measurements
- Channel occupancy measurements
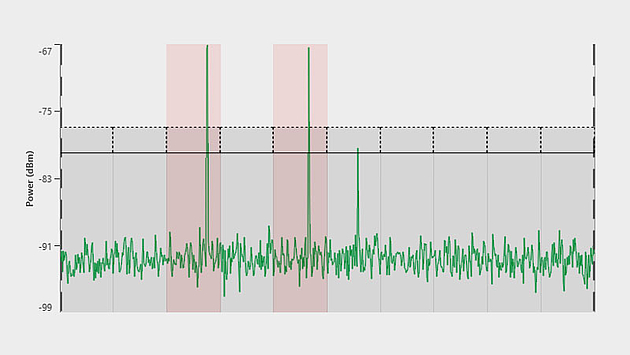
Alarming & Automation
- Automatic Violation Detection (AVD)
- Automatic detection of anomalies like interference or illegal spectrum usage
- Based on:
- AI compares trained reference situation with new data
- Manual definition of upper and or lower thresholds
- Reference level from wave-prop calculation (Input Tx database)
- Auto calculation of thresholds from reference recording
- Alarm triggering via email
- Alarm history in alarm logs and alarm reports
- AVD triggered actions NEW
- AVD alarm automatically triggers measurement features on secondary receiver and unit(s)
- Recording of IQ or Raw for and around the violated band/channel
- Direction-finding from multiple locations to geolocate the source of the alarm
- Automated measurement jobs
- Pre-definition of measurement parameters, analysis features, time and area
- Multi-band jobs: Individual parameters and measurement features per defined band
- Automatic execution of job
- Option for recurring jobs (minutely, hourly, daily, monthly)
- On-demand jobs that can be initiated with a single click from the cockpit NEW

Artificial Intelligence (AI) features
- AI based automatic violation detection (SMART AVD)
- Automatic detection of anomalies like interference, outages, illegal or suspicious emissions
- Deep learning based on the recorded reference spectrum per band
- Adaptation to changes in spectrum environment with relearning
- Alert info via email, storage of alert logs and alert report generation
- AI based signal classification
- Large signal library
- Multi-channel classification option based on channel grid
- Adaptable to local signal environment
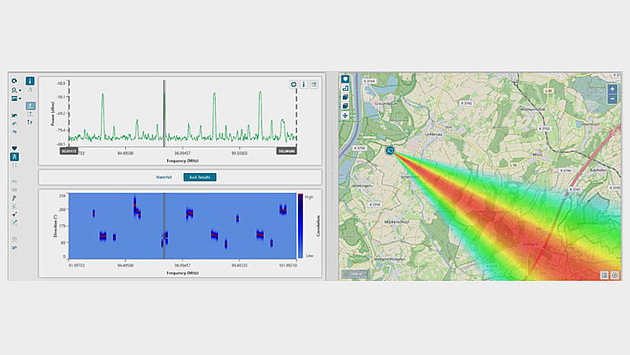
Direction finding
- Angle of arrival (AoA) technology
- Live and based on stored data
- DF Time Travel®: DF based on stored spectrum
- LoB and heatmap map view
- Multi-channel direction finding
- Mode to perform DF for frequency hopping systems
- Manual direction finding & homing with directional antennas (handheld, rotator based, drone based)
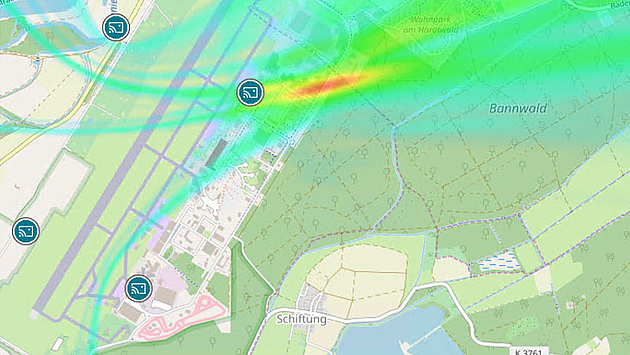
Geolocation
- Time difference of arrival (TDOA)
- Evaluation based on time differences of an arriving wave at multiple stations
- Precise results presented as live heatmap
- Triangulation of DF measurements
- Triangulation of multiple lines of bearing from different direction finders
- Heatmap as triangulation result in addition lines of bearing display
- Hybrid geolocation
- Combines AOA and TDOA method
- Available for multiple heterogeneous device types, including 3rd party devices
- Common result heatmap

Analysis based on stored data
- Remote access to storage of monitoring unit or server
- Data search & filtering for display and download
- Analysis of channel utilization with frequency channel occupancy (FCO) data
- Channel analysis for channel power, FCO, level, field strength, direction
- Noise-free data
- Statistical spectrum overview data
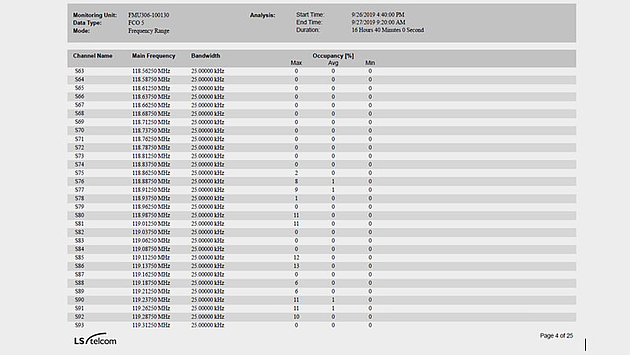
Reporting and Exporting
- Channel analysis results, alarm history and correlation available as .pdf report
- Single and batch screenshot feature
- Export of measurement data as .csv or .xml
- Various data compression options
- Export for IQ data as .wav files
- Export of channel analysis results to .xlsx

Interface to Spectrum Management & Correlation
- Interface to mySPECTRA
- Import of transmitter data in .xlsx or .csv format
- Correlation NEW
- Analysis, which compares entries from the transmitter database with measurement data
- Parameters: Direction, Center frequency, Bandwidth, Field strength (utilizing built in wave-prop calculations to calculate the expected level at the monitoring unit)
- User can specify individual “allowed delta” values for each correlation property
- Comprehensive result table and report
- Transmitter data display
- Frequency plan overlay in measurement charts NEW
- Utilization of transmitter data to calculate expected level for AVD feature to verify license conditions
- Monitoring data as decision basis for new allocations or re-allocations